The most detailed map to date of the landscape beneath Antarctica's ice sheet has been produced by an international team of scientists led by the British Antarctic Survey (BAS).
The new map, named Bedmap3, lifts Antarctica’s icy veil.
It is the culmination of more than 60 years of research.
Bedmap3 combines data from aircraft, satellites, ships, and even dog sleds to build a vivid portrait of Antarctica, as if its 27 million cubic kilometers of ice had vanished.
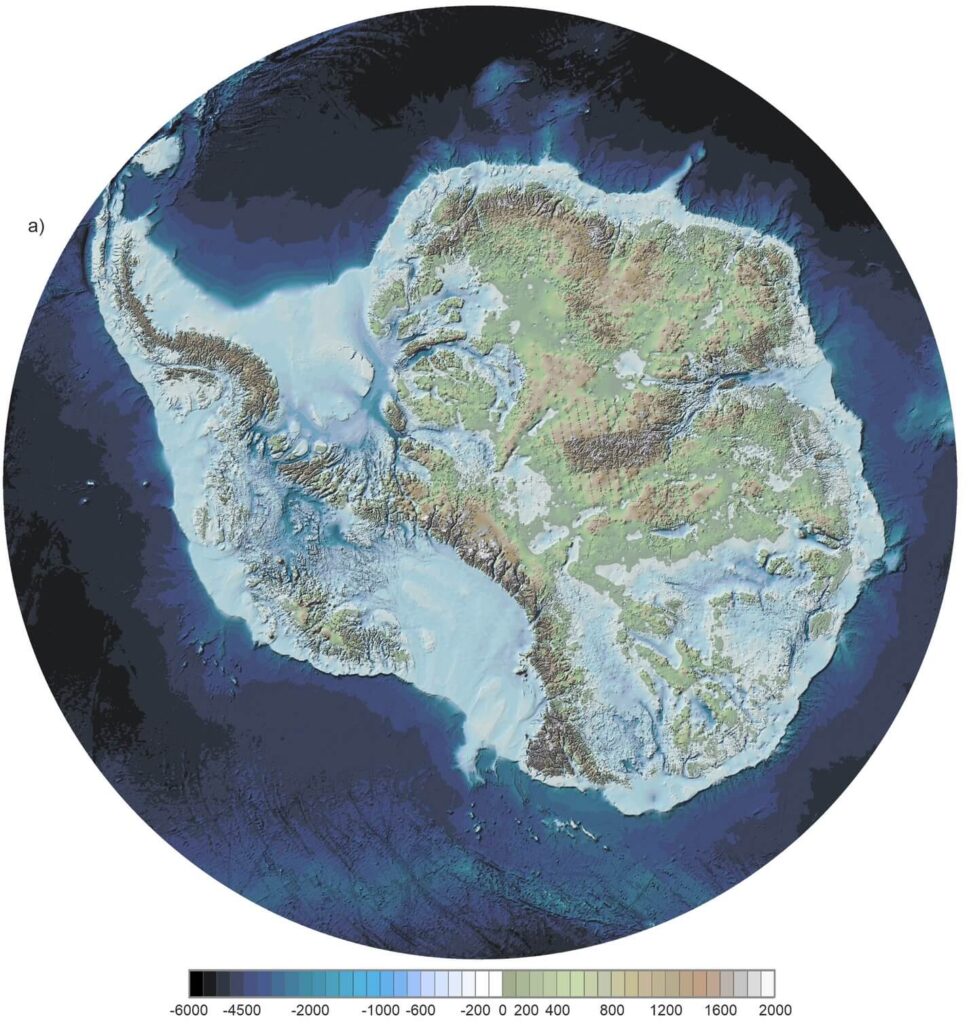
Credit: Pritchard et al. BAS
The bedrock topography beneath the Antarctic ice sheet is crucial for understanding the dynamic flow of the ice sheet, its thickness, and its influence on the surrounding ocean and global climate.
In 2001, the British Antarctic Survey (BAS) released a map of the bed beneath the Antarctic ice sheet and the seabed extending out to the continental shelf, derived from data collected by an international consortium of scientists over the previous fifty years.
The resulting dataset is called BEDMAP (or BEDMAP1).
In 2013, BAS published an updated topographic dataset known as BEDMAP2, incorporating twenty-five million measurements taken over the preceding two decades from ground, air, and space.
This visualization compares the new BEDMAP2 dataset with the original BEDMAP1 dataset, illustrating the remarkable gains in resolution and coverage.
Since 2009, NASA’s Operation IceBridge mission (OIB) has flown aircraft over the Antarctic ice sheet equipped with laser instruments and ice-penetrating radar to gather data on surface elevation, bedrock topography, and ice thickness.
This visualization highlights OIB's vital contribution to this landmark dataset.
The topography in this visualization is vertically exaggerated to emphasize the terrain's relief.
The degree of exaggeration varies depending on the vantage point, from twenty times for distant vistas to nine times for close-up views of Pine Island Bay in the Amundsen Sea.
Bedmap3's Resolution Is Unprecedented
The map is gridded at 500-meter intervals, compared to the 5-kilometer grids used in previous charts.
This finer scale enables scientists to uncover subglacial features such as mountains and valleys that were previously blurred or completely hidden.
One striking revision lies in pinpointing where the thickest ice resides.
Earlier maps designated the Astrolabe Basin in Adélie Land as the record holder.
Yet Bedmap3 reveals that the true heavyweight lies within an unnamed canyon in Wilkes Land (stretching between Enderby Land to the west and Adélie Land to the east), where the ice plunges to a staggering thickness of 4,757 meters—more than 15 Eiffel Towers deep.
Peter Fretwell, mapping specialist and co-author at BAS, explains: "Overall, it has become evident that the Antarctic ice sheet is thicker than previously thought, holding a larger volume of ice resting on bedrock that sits below sea level. The risk of ice loss is consequently higher due to warm ocean water incursions occurring around the fringes of the continent. Bedmap3 shows us that Antarctica is somewhat more vulnerable than we realized."